
Income Growth, Affordability, And A Shifting Market in Phoenix, Arizona.
- Brad Daniels

- Dec 22, 2025
- 7 min read
Income Growth, Affordability, And A Shifting Market in Phoenix, Arizona.
For Buyers
Journalists covering housing affordability frequently quote sources citing median household income. Household income can be broken down into two categories, family and non-family households. The US Census defines a family household as two or more people living in a home and related by blood or marriage. Non-family households include all others, such as unrelated people living together or alone. Non-family household income is typically much lower than family income and is more suited for measuring the affordability of rental housing. Family household income is better suited to measuring the affordability of home ownership.
From 2020 to 2024, the median annual household income in Maricopa County rose 33% from $68K to $91K. The non-family median household income rose from $44.5K to $59K. Family income rose from $80K to $108K; and married family income, a subset of family income, rose from $95K to $126K.
The lending industry considers 28% of gross income an affordable monthly payment for mortgage or rent. For a family household, that’s roughly a $2,500-$3,000 payment. At a mortgage rate holding steady around 6.25%, that payment supports homes priced between $350,000 and $500,000 in Maricopa County. That budget will help a roughly 1,500-1,800-square-foot single-family home, priced in the mid-$300s in the West Valley and the mid-$400s in the Southeast Valley.
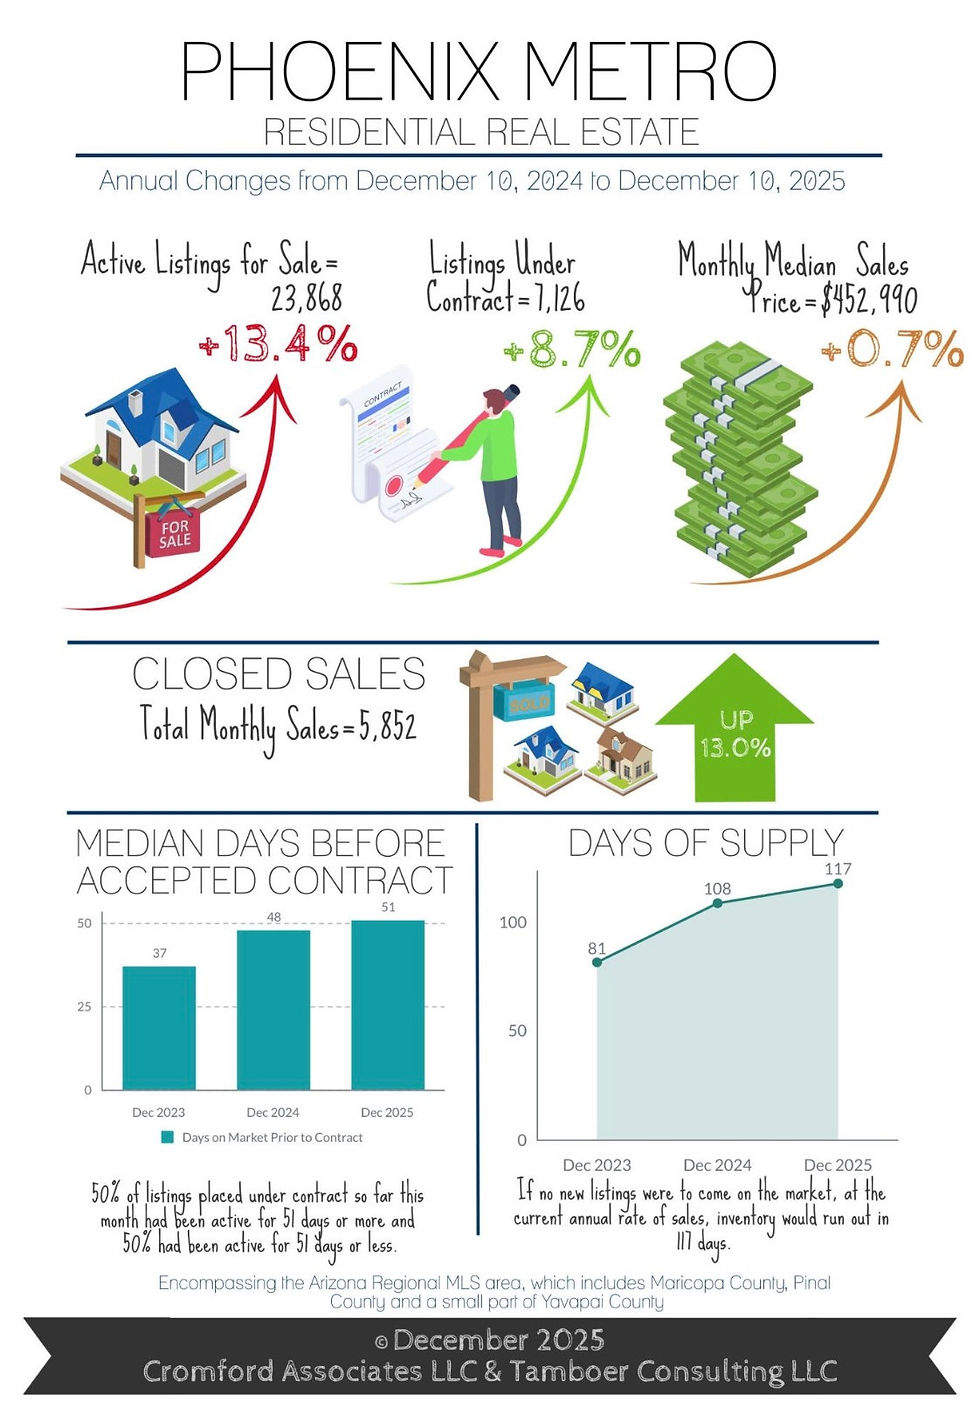
Incomes in Maricopa County have not been stagnant and have risen significantly since 2020. It’s home values that have been stagnant for 3 years, waiting for family incomes to catch up and mortgage rates to decline. Inventory under $500K accounts for roughly 57% of all inventory for sale and is up 16% from last year. With rates holding steady in the low 6% range over the past 4 months, demand and optimism are up at the start of 2026.
For Sellers
November closings were another success in Q4 2025, up 3.3% from last November, and it was even better than that. Last November had 19 closing days, compared to this November's 18, meaning this year November closed an extra 23 sales per day, bringing the improvement to 9% instead of 3%. So far, December is also outpacing last year by an average of 14 closings per day. If this is a preview of what 2026 may bring, sellers should be optimistic about contract activity in January.
The key question is how many listings will align with January’s expected increase in demand. January is typically the top month for luxury, retirement, and seasonal community listings to hit the market. However, new listings across all price points and areas often see a peak in March, providing ample selection for Spring buyers. This front-loading of inventory in the first part of the year usually results in more price reductions, the number of which depends on whether we enter the year in a buyer’s market, a balanced market, or a seller’s market.
Recent improvements in demand, combined with declines in supply, are pushing the Cromford Market Index back toward a balanced state. While Greater Phoenix remains overall in a buyer’s market, central and established cities are the first to move back into seller’s markets. Most recently, Phoenix, Mesa, and Tempe shifted back into seller’s markets within the last 30 days, putting nearly all cities in the Northeast and Southeast Valley in seller’s markets, except buyer’s markets Queen Creek and Sun Lakes. Developing cities on the edges of Metro Phoenix are typically the last ones to pull out of a buyer’s market. Pinal County cities, for example, are buyer’s markets except for Apache Junction, which is a seller’s market. The West Valley is a mix, as El Mirage is a small seller’s market, and Peoria recently shifted into a balanced market, joining Glendale, Avondale, and Laveen. All other West Valley cities are buyer’s markets.
Don’t expect much upward pressure on price in the short term, even if your city has shifted back into a seller’s market. Prices can take up to 6 months to respond to a shift, which means the seller’s market must be maintained, and many of these cities are still relatively weak. What sellers can expect is more showings, shorter days on market, and less pressure to reduce their prices once the Spring buying season begins.
When the Data Speaks: A Cooling Economy Puts the Fed Under Pressure
Jerome Powell often says that the Fed is “data dependent.” The latest data clearly showed both a slowing job market and easing inflation. The December Fed rate cut now looks well-justified, but the market remains skeptical that the Fed will cut again on January 28.
BLS jobs report = weakness all around
We received data for both October and November, which painted a clear picture of a slowing job market.
Jobs growth of just 64K in November, but that was after -108K (affected by the government shutdown) in October. In addition, previously released figures were revised down by 59K.
The narrow unemployment rate (U-3) rose from 4.4% in September to 4.6% in November (we didn’t get the October number). The broader unemployment rate (U-6) rose from 8.0% in September to 8.7% in November. Ignoring COVID, that’s the highest since March 2017.
The number of permanent (full-time) jobs fell by 983K between September and November, while part-time jobs rose by 1.0M. We’re replacing full-time jobs with part-time roles. Not a good trend.

And remember: Fed Chair Jerome Powell estimated these numbers were likely overstated by ~60,000/month due to the birth/death model and other factors. If he’s right, that would take October to -168K and November to +4K (essentially flat).
The two Fed members who dissented at the last meeting (preferring to keep the Fed Funds Rate unchanged) have to review this report and think, ‘maybe I’m missing something’. The U-3 has risen from a low of 3.4% in April 2023 to 4.6% in November 2025, and the U-6 has increased from a low of 6.6% in April 2023 to 8.7% in November 2025.
Lowest “core” CPI in years
We also received October and November inflation data, which were much lower than expected. Both “headline” and “core” CPI (Consumer Price Index = inflation for you and me) climbed just +0.2% over the last two months, allowing the annual inflation rate for “headline” CPI to fall to +2.7% YoY and “core” CPI to drop to 2.6% YoY. That’s the slowest rate of “core” CPI growth since April 2021!
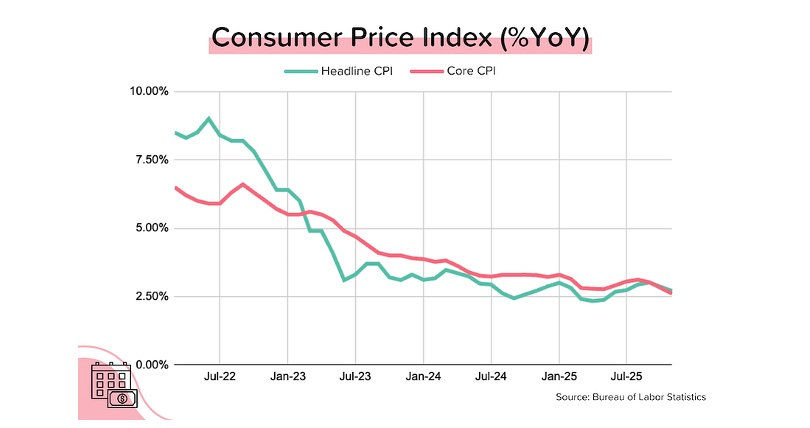
Shelter costs (which make up 35% of “headline” and 44% of “core” CPI rose just 0.2% over the last two months. As a result, annual Shelter cost growth plunged to just +3.0%!
If you annualize the last 3 months of CPI growth, you get 2.0% YoY for “headline” and 1.7% YoY for “core”. When you consider that the Fed’s preferred measure of inflation (“core” PCE) is generally LOWER than the CPI (due to category weighting differences), this means that we’re running at/below the Fed’s 2% target.
Crude oil prices are down 22% this year. What does this have to do with housing? Directly, not much. But it can have a significant impact on “headline” inflation figures (6.5% weighting in “headline” CPI), and that can obviously affect the Fed’s policy decision.
Bond and Mortgage Market
If you were a Fed member looking for justification to cut rates further, this was your week. A big jump in the unemployment rate, plus a significant drop in the rate of inflation? Yes, please! Unfortunately, the global rise in bond yields appears to be keeping the 10-year US Treasury yield higher than it would otherwise be. Still, average 30-yr mortgage rates (from Freddie Mac’s PMMS survey) remained below 6.25%, and the start of the spring selling season isn’t far away.
Note: After the rate cut on Dec 10, the Fed Funds Rate policy range is now 3.50–3.75%. The probabilities below are sourced from the CME Group website and are implied by the Fed Funds Rate futures market.
January 28 FOMC Meeting: 73% probability that the Fed does nothing; only a 27% probability of a 25 bps rate cut.
March 18 FOMC Meeting: 47% probability that rates are 25 bps below current. That means a rate cut at either the January 28 or the March 18 meeting, but not at both. 43% probability that the Fed Funds Rate target range is kept at 3.50–3.75%. In other words, no cut at either the January or March FOMC meetings.
They Said It
In positive signs for the market, builders report that future sales expectations have been above the key breakeven level of 50 for the past three months, and the recent easing of monetary policy should help builder loan conditions at the start of 2026. However, builders continue to face supply-side headwinds, as regulatory costs and material prices remain stubbornly high. Rising inventory also has increased competition for newly built homes.” — Robert Dietz, NAHB’s Chief Economist.

Market in a Minute

Housing
Seller momentum is building: Demand is rising while supply continues to fall, pushing the Cromford Market Index up an average of +10.1% over the last month, with seller conditions improving in most cities — including Phoenix, Scottsdale, Mesa, Peoria, Gilbert, Chandler, and Goodyear.
Single-family homes are leading the recovery: Sales activity for detached homes and mobile homes is strong and nearing record levels, while condos and townhomes continue to lag, reflecting tighter financing, higher HOA and insurance costs, and shifting buyer preferences toward space and privacy.
Markets are rebalancing unevenly: 9 of the 18 largest Valley cities are now seller’s markets, three are balanced, and only 6 remain buyer-leaning — a notable improvement from just a month ago, even though attached housing remains a slower segment.
Economy
Jobs are slowing: Payroll growth weakened sharply, unemployment rose (U-3 at 4.6%, U-6 at 8.7%), and full-time jobs declined while part-time jobs increased — clear signs the labor market is cooling.
Inflation is easing: Core inflation is at its slowest pace since 2021, shelter costs are rising more slowly, and recent CPI trends are running at or below the Fed’s 2% target.
Rates likely hold short-term: December’s rate cut looks justified, but markets expect the Fed to pause in January, with mortgage rates holding near the low-6% range heading into spring.

Have a great week!


Comments