
November Real Estate Insights: Shifting Trends for Buyers and Sellers in Phoenix, AZ
- Brad Daniels

- Nov 24, 2025
- 6 min read

November Real Estate Insights: Shifting Trends for Buyers and Sellers in Phoenix, AZ
For Buyers
It’s been an exciting month of November since President Trump floated the idea of a 50-year mortgage to help some buyers qualify to purchase a home. Initial reactions from the industry have spurred a healthy discussion about its potential impact on borrowers, affordability, and demand. Since then, multiple ideas have been circulating for new products that reduce payments without extending the loan term. It could get interesting!
For context, on a $400,000 loan at 6.25%, the PI (principal and interest) payment on a 30-year loan is $2,463, and on a 50-year loan is $2,180, a difference of $283/month or 11.5%. But the cost of that savings is a much slower repayment of the loan. For example, after 3 years of payments, a borrower would have paid down their loan by roughly $15,000 on a 30-year mortgage, but only $3,800 on a 50-year mortgage. It would take 9-10 years of payments to pay down the same 50-year mortgage by $15,000. This can create issues when it comes to obtaining an equity loan for expensive maintenance items, such as a new A/C unit, or remodeling projects within 10 years of homeownership. That puts a lot of importance on annual appreciation to build equity.
The good news for first-time homebuyers looking under $400,000 is that Greater Phoenix price measures have fallen 10-14% from the 2022 peak and 3-5% in the last year alone. At 6.25%, mortgage rates are down from their peak of 7.25% at the beginning of 2025 and 0.5% lower than rates from last July, which has reduced the PI payment by 5-10%. Lower prices, combined with mortgage rates down a full 1%, have put payments down 13-15% over the last year. This does not include the extra 20% off in the first year provided by temporary buydowns paid for by 60-70% of sellers in this price range. Supply of properties under $300K is up 39% over last year, prices are down 5%, October sales increased 21%, and new contracts are up 32% so far in November.
According to the Bureau of Labor Statistics, US wage growth has been outpacing inflation for 2 years now. Over the past 2 years, Greater Phoenix's average hourly earnings have grown by 12%, while the concurrent CPI inflation rate for the area shows prices have risen by only 3.3%. This growth, combined with home prices coming down in the most affordable price ranges, means that a 50-year mortgage may not be needed to bring affordability measures into a manageable range. They may already be there for a growing number of buyers.

For Sellers
It took a while for the buyers to mobilize, but better late than never. So far, this is the best 4th quarter Greater Phoenix has seen in 3 years for contract activity. Listings under contract are up 15% over last year, with notable improvements in the market under $300K and the market over $1M. The government shutdown didn’t help closings for FHA and VA transactions, especially between $ 300K and $600K, but October saw a 3.3% increase in sales regardless, and closings delayed will add to the November sales counts.
The Federal Reserve met on October 29th and announced a 0.25% decrease in the Federal Funds Rate and the end of the reduction of their securities holdings as of December 1st. This is another step towards easing quantitative tightening and should stabilize future mortgage rates. That is good news for sellers.
In the meantime, stock market performance, corporate profits, and cryptocurrency have performed well enough to boost the luxury market in Q4. Contracts in escrow between $ 1M and $2M are up 25% over the past 5 weeks and 16% over last year. Contracts in escrow over $2M have risen 25% over the past 9 weeks, up 7% from last year. It hasn’t been enough to boost contract sales much in retirement communities, but Sun City, Sun City West, and Sun Lakes are not doing worse than last year.
Contract activity typically drops after the Thanksgiving holiday until the new year begins. This sparks a wave of price reductions just before Thanksgiving, followed by a trickle in December. January is the most popular month for new listings to hit the market, so properties that don’t sell between now and December should expect another wave of price reductions in the first few weeks of January.
Overall, while demand is slowly improving, supply is still on the rise and keeping most cities in a balanced or buyer’s market. Prices are still under pressure, and buyers are seeking the best value for their budgets. Competition and negotiations can get fierce in December, especially in those areas competing with new home subdivisions.
Conflicting Jobs Data Undercuts Expectations
for a December Rate Cut
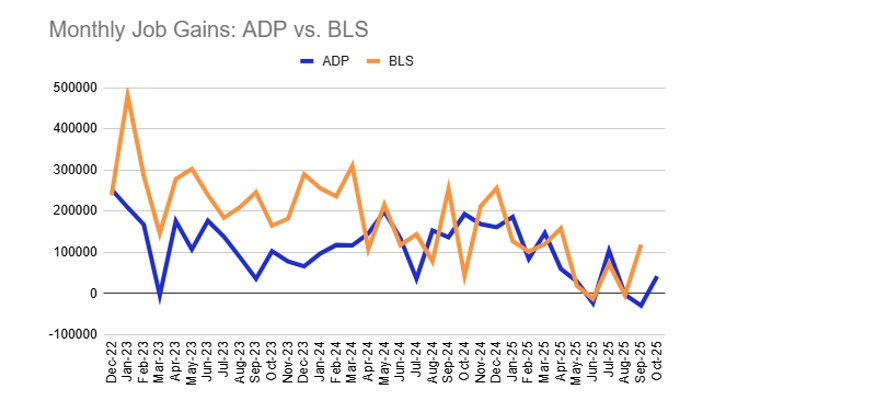
The government jobs data is starting to flow in, and it seems to be contradicting what we’ve been seeing from private sources like ADP. As a result, hopes are fading for a 3rd Fed rate cut on December 10.
Delayed BLS jobs data for September. The US economy added 119,000 jobs in September, well ahead of Wall Street expectations of +60,000 and far better than the 4,000 jobs lost in August. However, the unemployment rate rose from 4.3% to 4.4%, and was only a whisker away from being rounded up to 4.5%.
Because of the government shutdown, this report was delayed, and the Bureau of Labor Statistics will release only partial October data – without an unemployment rate – alongside the full November report on December 16.
That timing matters because it’s after the Fed’s next policy meeting on December 9-10. The Fed has already cut the Fed Funds Rate in September and October as it balances above-target inflation with signs of a cooling labor market.
After the October meeting, Chair Jerome Powell emphasized there is “no risk-free path” and that a December rate cut is “not a foregone conclusion.” Meeting minutes showed debate and a majority leaning against a December cut. With no new job reports before the meeting, the likelihood of another cut remains uncertain.
ADP’s weekly “NER Pulse” report showed continued job losses. Private employers shed an average of 2,500 jobs per week for the four weeks leading up to November 1. While that was better than the 11,250 jobs lost per week leading up to October 25, it’s still consistent with a labor market that is (slowly) going backwards.

When the line above is moving up, job losses are decreasing, or job gains are increasing. When it’s moving down, job gains are decreasin,g or job losses are increasing. Probably the most important thing from this graph is that the average weekly job gain is around ZERO.
Bond and Mortgage Market
If you add everything up: 1) the “hawkish” minutes from the Fed’s previous meeting, 2) the real-time weekly ADP jobs data, and 3) the just-released September BLS jobs data, you’d come to the conclusion that a Fed rate cut on December 10 is unlikely. We can certainly expect a number of dissenting voices, but it looks like the Fed is finished for 2025.
Note: After the rate cut on Oct 29, the Fed Funds Rate policy range is now 3.75–4.00%. The probabilities below come from the CME Group website and are implied from the Fed Funds Rate futures market.
December 10 FOMC Meeting: 60% probability that rates will be unchanged (no rate cut). 40% probability that rates will be 25 bps below current (was 91% a month ago).
January 28 FOMC Meeting: 50% probability that rates will be 25 bps below current (same as last week). That implies a 25 bps rate cut at one of the December and January meetings. 20% probability that rates will be 50 bps below current levels, implying a rate cut at both the December and January meetings.

Market in a Minute...National View

Housing
Existing home sales in October were 1.7% higher than a year ago, though homes are staying on the market longer at an average of 34 days.
After making gains earlier this year, the inventory of homes for sale has fallen to a 4.4-month supply, or 1.52 million units.
The median sales price of a home sold in October was $415,200, or 2.1% higher than a year ago. It was the 28th consecutive month of annual gains.
Economy
September jobs data, released almost 7 weeks late, showed stronger-than-expected job creation, marking the biggest jump since April.
The unemployment rate grew to 4.4%, the highest level since October 2021. The increase was driven by an expansion in the labor force.
October's Fed meeting minutes revealed a divide among officials on rate cuts and whether inflation or the labor market poses the bigger threat.


Comments