
Still a Buyer’s Market… Just a Little Less in Phoenix, Arizona
- Brad Daniels

- Oct 27, 2025
- 4 min read

Still a Buyer’s Market… Just a Little Less in Phoenix, Arizona

As last week, 15 cities became more favorable for buyers over the past month, while the remaining 3 moved in a direction favorable for sellers. The latter group is Tempe, Gilbert, and Buckeye.
Leading the large group improving for buyers are Cave Creek, Peoria, and Avondale. All the other large cities that moved in favor of buyers did so by 6% or less.
The average change in Cromford Market Index (CMI)* was -2.6%, up from -2.8% last week. Though the trend still favors buyers, it has started to decelerate.
We have six cities in seller's markets, five in balanced markets, and seven in buyer's markets.
The primary reason for the trend favoring buyers is that supply is moving higher. With mortgage rates drifting lower over the last week, demand is improving, but still at a slow pace so far.
*Cromford Market Index™ is a value that provides a short-term forecast for the balance of the market. It is derived from the trends in pending, active, and sold listings compared with historical data over the previous four years. Values below 100 indicate a buyer's market, while values above 100 indicate a seller's market. A value of 100 indicates a balanced market
Behind the Headlines: What the Real Housing Data Says About Buyer Activity
Average mortgage rates are at their lowest levels in more than a year, already boosting refi activity and bringing buyers off the sidelines. Wouldn’t it be a treat if the September CPI report showed lower-than-expected inflation?
Consumer Price Index (Sep 2025)
September inflation came in slightly better than expected: the Consumer Price Index (CPI) rose to 3% year-over-year, while Core CPI eased to 3%.

The Fault in our SAARs?
The media loves writing stories like “the fall in mortgage rates has failed to bring buyers off the sidelines.” And, to be fair, the 4.06 million units (SAAR) figure we just got for September 2025 existing home sales seems to support those clickbait headlines. After all, we’ve been selling homes at a 4 million unit annual pace for most of the last three years.
But what if I told you that the non-seasonally-adjusted (NSA, or “raw”) figure for existing home sales was up 8.2% year-over-year in September?!
As a reminder, the “raw” data is the actual monthly sales figure. The market actually sold 357,000 existing homes in September 2025. To turn that into a seasonally-adjusted, annualized rate (SAAR), you apply an adjustment factor (to account for seasonality) and then multiply that by 12 (months of the year).
Typically, in September, NSA existing-home sales fall by 10–15% month over month. It’s a seasonal thing. Happens every year. But in September 2025, they only fell 5.1% MoM. In other words, they fell by much less than normal seasonality would predict.
If not for an adjustment in the seasonal adjustment factor (SAF) used to calculate the seasonally-adjusted pace, the SAAR rate for existing home sales in September could have easily been 4.2 million.
So, we’re actually seeing more of a mortgage-rate-fall-driven increase in activity than is apparent in the SAAR figures.
2024:Sept NSA Sales: 330KSAF: 0.98Sept SAAR: (330K X 0.98 X 12) = 3.9m
2025:Sept NSA Sales: 357K (+8.2% YoY as above)SAF: 0.95Sept SAAR: (357K X 0.95 X 12) = 4.07m
You might think “0.95 vs. 0.98, who cares?” but if you instead use 0.98 for the Sept 2025 figure, you get 4.2 million SAAR — which would have been up 8% YoY and beat Wall Street estimates.
Moreover, as we move into October and especially November, the SAFs start to really boost the SAAR figure. So if we get an increase in the NSA figures in those months (or at least a smaller seasonal decline), we could get a 4.3 or 4.4 million SAAR print EASY.
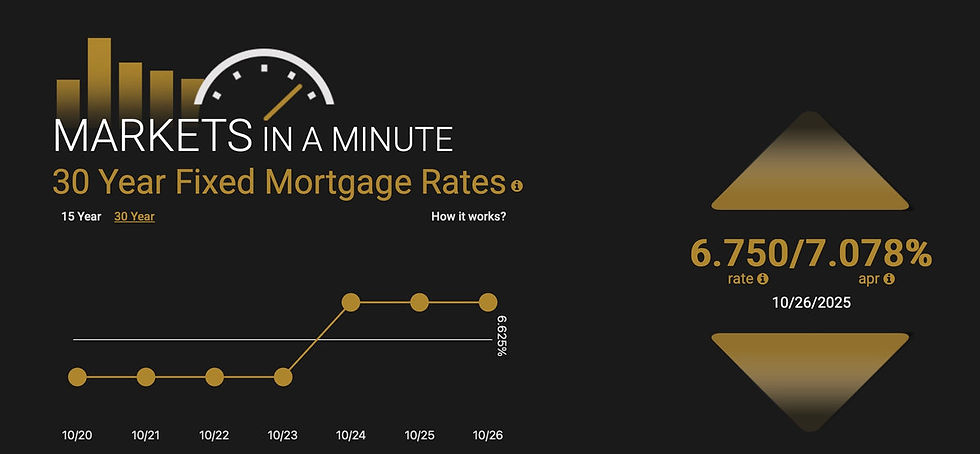
Bond and Mortgage Market
The yield on the 10-year US Treasury Bond has stayed below 4% (at one point last week, it was 3.95%), and average mortgage rates (according to Freddie Mac’s weekly survey) have dropped to 6.19% — the lowest rate in over a year. Remember: at the beginning of 2025, average rates were over 7%!
There is a wide range of opinion on where mortgage rates go from here. Barry Habib, the CEO & Founder of our parent company, MBS Highway, thinks that mortgage rates will continue to trend down as the Fed cuts rates, and could go as low as 5.5%. But the majority of forecasters believe rates will stay between 6–7% for the remainder of this year and on into 2026.
Note: The Fed Funds Rate policy range is now 4.00–4.25%. These probabilities are sourced from the CME Group website and are implied by the Fed Funds Rate futures market.
October 29 FOMC Meeting: 99% probability that rates will be 25 bps below current (same as last week). In other words, a second 25 bps rate cut on October 29.
December 10 FOMC Meeting: 92% probability that rates will be 50 bps below current (was 97% last week). In other words, a third 25 bps rate cut on December 10.
Market in a Minute...National View
Housing Market
Falling mortgage rates prompted buyers to act in September. Existing home sales rose 1.5% to reach a 7-month high.
The median existing home price last month grew 2.1% year over year to $415,200. Inventory rose to 4.6 months, up from 4.2 months a year ago
Purchase apps fell 0.3% for the week but were 20% higher than the same time last year. Refi apps grew by 4% for the week and 81% year over year.
Economy
The government shutdown drags on, stalling key economic reports and leaving the Fed and markets short on fresh data.
Markets still expect the Fed to cut its policy rate at next week's meeting, and investors anticipate a 3rd rate cut this year in December.
Consumers expect to spend $890 per person on the holidays this year, down from $902 in 2024, per a National Retail Federation survey.

Hi, I’m Brad Daniels, your neighbor and the valley's real estate expert. I’ve been helping Arizona families make smart moves for over 25 years — and I’d love to help you next!
#RelocateToAZ #CallBradToSellYourPad (602) 679-1025


Comments