
Seller’s Market Strengthens in Phoenix, Arizona
- Brad Daniels

- Aug 4, 2025
- 5 min read

The trend that began two weeks ago has not only continued—it’s gained steam. Over the past month, the Seller’s Market has strengthened in Phoenix, Arizona. The average monthly change in the Cromford Market Index (CMI)* has accelerated to +4.5%, a significant jump from +2.7% last week.

Eleven cities have improved for sellers, while only six have seen conditions improve for buyers. Once again, Paradise Valley is a major driver of this trend. With only 98 single-family homes currently listed, inventory is approaching historic lows. For context, there were 136 listings this time last year, and we haven’t seen inventory dip below 100 since the red-hot market of 2022.
Low supply is the key factor behind this shift. New listings are arriving at a much slower pace, which is tipping the scales—even though demand has remained relatively flat.
Not all areas are seeing gains, however. Maricopa has now taken the bottom spot on the seller-friendly list, swapping places with Buckeye. With 666 homes for sale, Maricopa's inventory stands well above its long-term average of 415, highlighting the oversupply issue in that market.
Meanwhile, the luxury sector continues to outperform, with Scottsdale and Cave Creek showing the strongest improvements for sellers. Both cities benefit from limited inventory and steady interest at higher price points, further solidifying the upper end of the market as the most resilient segment in today's environment.
As always, market conditions vary by city and even by neighborhood. If you’re thinking about buying or selling, let’s connect to talk about what this means for your plans.
*(CMI) Cromford Market Index™ is a value that provides a short-term forecast for the balance of the market. It is derived from the trends in pending, active, and sold listings compared with historical data over the previous four years. Values below 100 indicate a buyer's market, while values above 100 indicate a seller's market. A value of 100 indicates a balanced market.
Mortgage Market and Economic Update – Week Ending 08/01/2025
A hectic week with the FMOC meeting, jobs data (JOLTs, ADP), and inflation (PCE). Let’s take a look….
Fed kept rates on hold, but not everyone agreed.
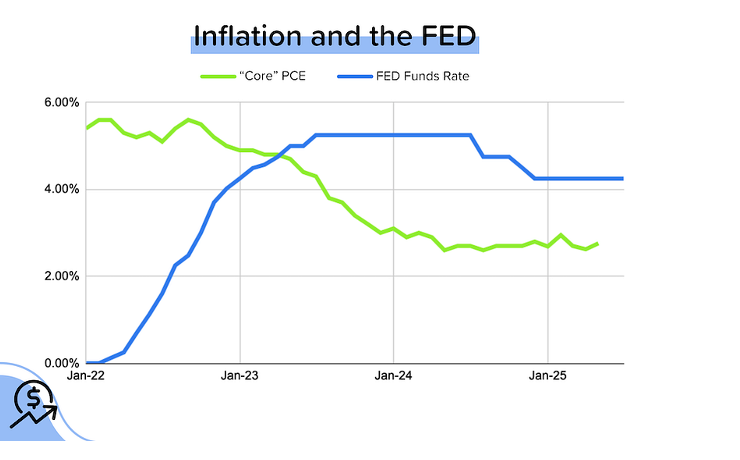
As expected, the Federal Reserve held its policy rate range steady at 4.25–4.50%. But unusually for the consensus-loving Fed, two voters (Christopher Waller and Michelle Bowman) dissented. They wanted a 25 basis point (0.25% = one quarter of a percentage point) cut instead. [Federal Reserve]
Most of the FOMC (Federal Open Market Committee) votes are unanimous. It’s rare for even a single member to dissent publicly. Why? Because the Fed chairman wants to create the appearance of 100% agreement with the decision, even if there is a lot of debate going on behind the scenes. That’s why having two voters dissent is shocking, at least by Fed standards. If you’d like to learn more about how the Fed works, I highly encourage you to read Danielle DiMartino Booth’s “Fed Up”.
JOLTs: Job openings contracted.
That’s right, it’s jobs week again! We started with the Job Openings and Labor Turnover Survey, which showed that employers had 7.4 million job openings in May, down 4% from 7.7 million in April. Both hiring and firing activity remained very low. Companies aren’t confident enough to hire more workers, and workers aren’t certain they can find better pay elsewhere. [BLS]
ADP: Private job growth rebounded.
Private employers added 104K jobs in June. That was better than expected (~75K) and a significant improvement from the 23K jobs LOST in May. Wage growth stayed at +4.4% YoY. [ADP]
Finally! BLS Data Reflects Reality
The July jobs report from the Bureau of Labor Statistics showed just 73,000 new jobs created, falling short of the 110,000 estimate. While the raw data actually indicated over 1 million job losses, seasonal adjustments and the often-debated Birth/Death model helped boost the headline number into positive territory. Without that model, job growth would’ve likely been negative.
It’s also important to note that previous months were quietly revised downward by a combined 258,000 jobs! May’s job count, which was initially reported as 139,000 and later revised to 144,000, has now been slashed to just 19,000. June’s numbers were also adjusted down from 147,000 to only 14,000, with another possible revision still ahead.
These ongoing changes highlight how unstable the job data has been this year, with average monthly revisions exceeding 77,000 jobs, more than double last year’s average. So even though July’s report shows growth on paper, there's a strong chance it will be revised lower in the months ahead.
In terms of sector details, private sector hiring totaled 83,000, with most gains in education and healthcare. However, even those figures were flattened after prior data were revised.

Bond and Mortgage Market
You might think that two people dissenting at the latest FOMC meeting might INCREASE the probability of rate cuts at the upcoming meetings. Instead, the opposite happened. That’s because Fed Chairman Jerome Powell delivered some fairly hawkish commentary at his post-meeting press conference. In a nutshell, he said that uncertainty remained high and that the impact of tariffs would be more noticeable in the inflation figures in the coming months.
Here’s what the Fed Funds Rate futures market is currently pricing in for rate cuts. A rate cut at the September meeting is no longer fully priced in. Note that the current Fed Funds Rate policy range is 4.25–4.50%.
September 17 FOMC Meeting: Only a 39% probability that rates will be 25 bps below current (down from 61% a week ago)! 61% probability that rates will remain at 4.25–4.50%.
October 29 FOMC Meeting: 38% probability that rates will remain at 4.25–4.50%. There is a 48% probability that rates will be 25 bps below the current rate. There is a 15% probability that rates will be 50 bps below the current rate.
December 10 FOMC Meeting: 41% probability that rates will be 25 bps below current. There is a 35% probability that rates will be 50 bps below the current rate (same as last week). 19% probability that rates will remain at 4.25–4.50%

Market in a Minute...National View

Housing Market
Sales of starter homes grew 3.9% year over year in June, reaching a two-year high. Their median price was $260K.
Fed Chair Powell addressed home affordability in his press conference, reiterating that the Fed rate plays only a small role in mortgage rates.
According to ICE, mortgage payment delinquencies rose month over month in June, while foreclosures trended higher year over year.
Economy
The Fed held policy rates steady at this week’s meeting, as it monitors the economic and inflationary fallout from tariffs.
June's PCE inflation index increased at one of the fastest paces this year, while consumer spending barely rose, demonstrating the effects of tariffs.
Multiple reports this week showed the labor market remains resilient, supporting the Fed's stance to hold policy rates steady.
🔥 East Valley Weather 🔥

Have a great week, and don't forget to Call Brad To Sell Your Pad!


Comments